

U.S. Multifamily

U.S. multifamily as the platform's stability anchor.

Income-oriented exposure across selected U.S. growth markets, structured with institutional discipline on basis, DSCR, and concentration.

Sleeve Profile

Sizing and structural targets.

$0M
Equity Allocation
~0%
Target LTV
Flex up to 65% only when basis & DSCR justify
$0B
Gross Acquisition Capacity
~0
Modeled Doors
~0–0
Target Assets
0-yr
Target Hold
70/30 A/A+ vs B/B+, flex 65/35 to 75/25

Market Allocation

Selected U.S. growth markets.

Maximum 22% per state, 14% per MSA. Concentration policy enforced at the IC level.

Florida
22%
North Carolina
20%
Texas
18%
Georgia
14%
Tennessee
8%
Arizona
8%
Indiana
5%
Alabama
5%

Acquisition Buy Box

200+ units. Major MSAs and adjacent growth pockets.

The multifamily sleeve targets institutional-scale assets of 200 units or more across the major MSAs in each approved state, plus surrounding counties and adjacent growth pockets where fundamentals, basis, and operator depth support the underwriting.

Unit Count

200+ doors

Minimum scale for institutional property management, capital efficiency, and operating leverage.

Asset Class

A / A+ · B / B+

70/30 A/A+ to B/B+ blend, flex 65/35–75/25 based on basis, DSCR, and submarket quality.

Geographic Lens

Major MSAs +

Major MSAs in each approved state and surrounding counties / adjacent pockets with durable demand drivers.

Florida
Miami–Fort Lauderdale–West Palm BeachMiami-Dade · Broward · Palm Beach
Tampa–St. Petersburg–ClearwaterHillsborough · Pinellas · Pasco · Hernando
Orlando–Kissimmee–SanfordOrange · Seminole · Osceola · Lake
JacksonvilleDuval · St. Johns · Clay · Nassau
North Carolina
Charlotte–Concord–GastoniaMecklenburg · Cabarrus · Union · Gaston · Iredell
Raleigh–Cary / Durham–Chapel HillWake · Durham · Orange · Johnston · Chatham
Greensboro–High Point / Winston-SalemGuilford · Forsyth · Randolph
Texas
Dallas–Fort Worth–Arlington (core focus)Dallas · Tarrant · Collin · Denton · Rockwall · Ellis
Houston–The Woodlands–Sugar LandHarris · Fort Bend · Montgomery · Brazoria
Austin–Round Rock–GeorgetownTravis · Williamson · Hays
San Antonio–New BraunfelsBexar · Comal · Guadalupe
Georgia
Atlanta–Sandy Springs–AlpharettaFulton · Cobb · DeKalb · Gwinnett · Forsyth · Cherokee · Henry
SavannahChatham · Effingham · Bryan
Augusta–Richmond CountyRichmond · Columbia
Tennessee
Nashville–Davidson–Murfreesboro–FranklinDavidson · Williamson · Rutherford · Wilson · Sumner
MemphisShelby · Tipton · DeSoto (MS)
KnoxvilleKnox · Blount · Anderson
ChattanoogaHamilton · Bradley
Arizona
Phoenix–Mesa–ChandlerMaricopa · Pinal
TucsonPima
Indiana
Indianapolis–Carmel–AndersonMarion · Hamilton · Hendricks · Johnson · Boone · Hancock
Fort WayneAllen · Whitley
Alabama
Birmingham–HooverJefferson · Shelby · St. Clair
HuntsvilleMadison · Limestone
MontgomeryMontgomery · Elmore · Autauga
Mobile / Daphne–FairhopeMobile · Baldwin

MSA and county lists are illustrative of the platform's primary acquisition lens; concentration limits (max 22% per state, 14% per MSA) apply at the IC level and final market selection is subject to underwriting, basis, and operator review.

Asset Mix

Class A/A+ anchored. B/B+ for ballast.
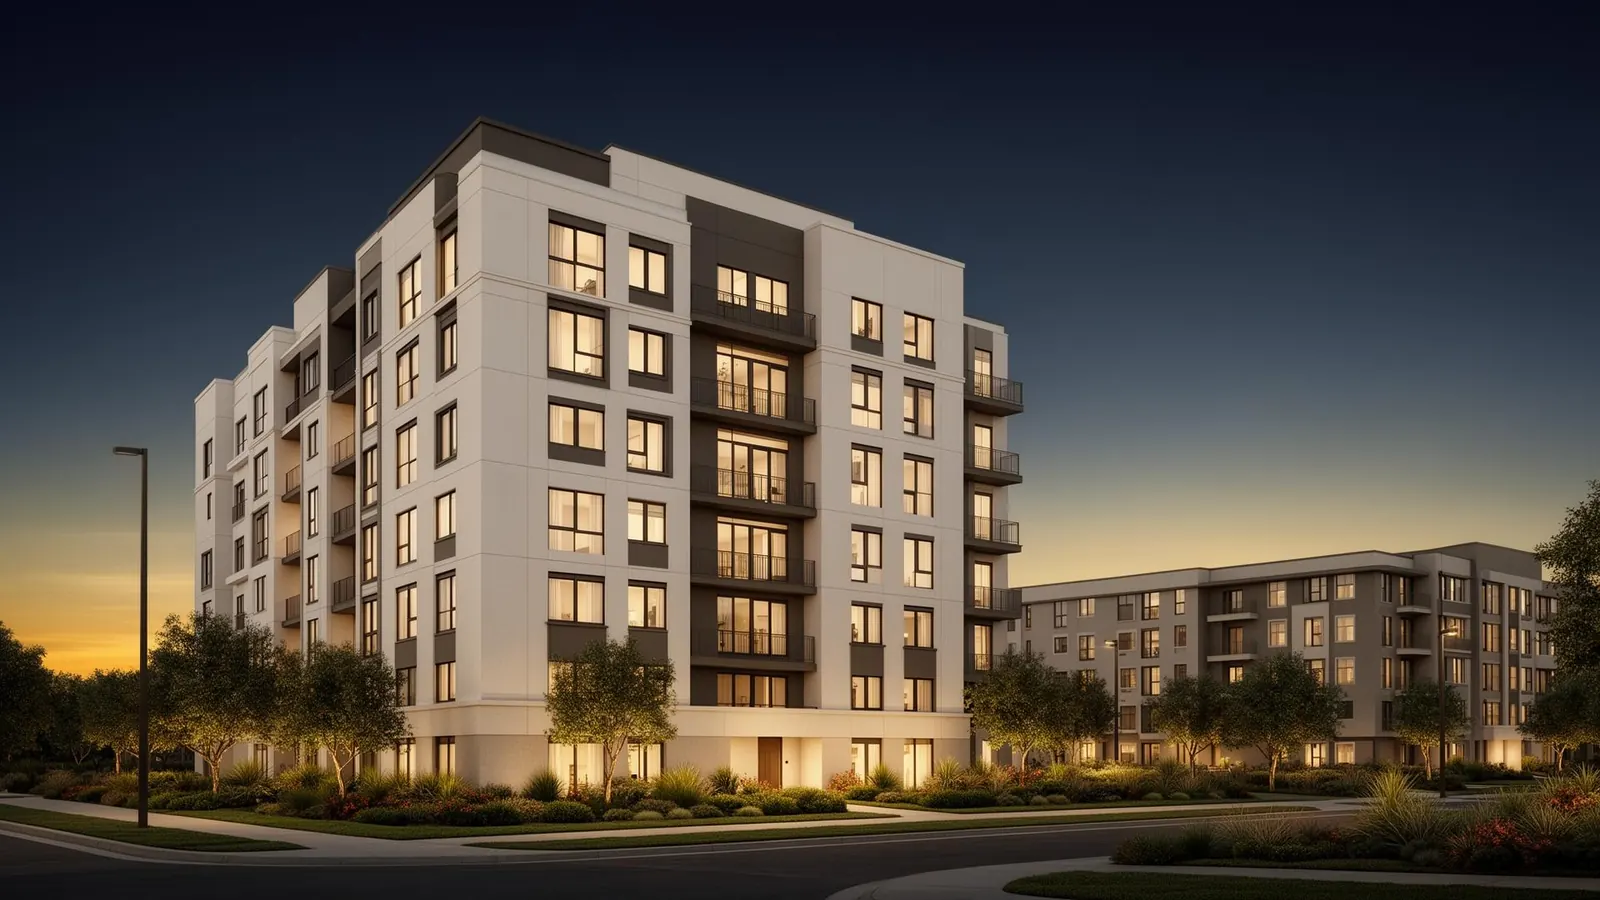
Modern Class A multifamily mid-rise beside a Class B garden-style property at dusk in a U.S. growth market

Class A / A+

70%

Newer institutional product in primary growth submarkets. Quality of basis, insurability, and durable demand are the principal selection criteria.

Class B / B+

30%

Selected B/B+ assets for cash-flow ballast where stabilized DSCR, replacement cost, and market fundamentals justify entry.